
Any pro sport is an exercise in percentages. Pro players are in the top 99.99 percentile of all human beings in that particular sport. This fact has the effect of skewing how we perceive bad and good players, and also how we estimate the impact of small but essential parts of the game.
The NHL is no different — in fact, the apparent randomness of the NHL (the best team wins the least number of games compared to the NFL and NBA) could make it ultimately more important. A small edge could lead to a systematic increase in games won, and a dramatic increase in the potential to take the cup home. In our analysis, we will work to uncover and unmask these small ideas and shine some light on some potential game-breakers.

Heads up — the interactive graphs below do not work great on small mobile devices. If you want to explore them it is best to view on a desktop or tablet.
First up is rebounds.
Goalies train for years to learn how to prevent them, entire teams focus on creating them. Seeing a slapshot from the point bounce off the goalie’s pad and onto the waiting stick of a teammate often leads to a goal. What we want to know is how important is that? Knowing not only how rebounds happen, but where, when and why might allow us to increase our chances of getting one — leading to more goals and more wins.
What’s in a Rebound?
Before we understand why rebounds are crucial, we need to understand precisely what a rebound is. Understanding that requires a breadth of data; luckily the NHL hosts and publishes the vast majority of in-game statistics. Plays are recorded down to the shot, and this allows us to mine and extract some interesting tidbits. In this piece, we are looking at over 7,000 games and over 400,000 shots.
Since we can not merely say which shots are considered rebounds (this is not categorized in the raw data), we can look for a statistical categorization by:
- Looking at the time between all shots, and;
- Looking for a significant deviation between the standard scoring rate vs an elevated scoring rate
The assumption would be that if rebounds indeed lead to better scoring chances, we would see a sharply better scoring rate. Below is a chart that looks at that scoring ratio plotted against the time between two shots.
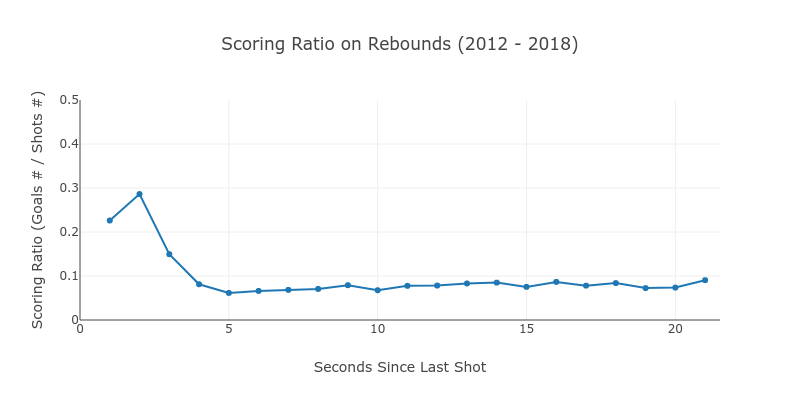
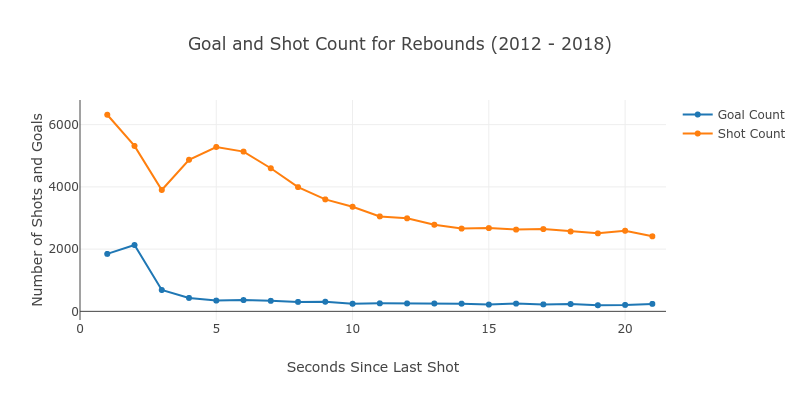
Clearly, there is a significant increase in the scoring ratio for anything less than three seconds (reaching a peak at two seconds). If the duration between the shot and the rebound is two seconds, there is almost four times the likelihood of scoring! Another unsurprising finding — there is a big spike in the number of shots and goals due to rebounds compared to all other shots.
Since we can safely say that there is a three second period after the first shot where there is a dramatic increase in the probability of scoring, we can confidently categorize all shots within this bound as “rebounds.” This will be very important to the rest of this piece.
1–2–3
Why are rebounds after two seconds better than rebounds after one? Why are rebounds after 2 seconds dramatically more important than five seconds later?
- If the next shot occurs in under three seconds, the goalie does not have sufficient time to reset and is out of position.
- Sub one-second shots are very likely to be quick shots one after another (think trying to jam the puck in). It is much more likely the player is not taking a clean rebound. This is reinforced by the fact that many more shots are taken under one second than under two.
- Two-second shots tend to be the sweet spot. At two seconds, the goalie has not had sufficient time to reset, AND the player has had time to take a set shot. This is also reinforced by the sharp drop in the number of shots at 2 seconds (think of this as the holy grail of rebounds). Now that we know “what” a rebound is, we can look at how important they are.
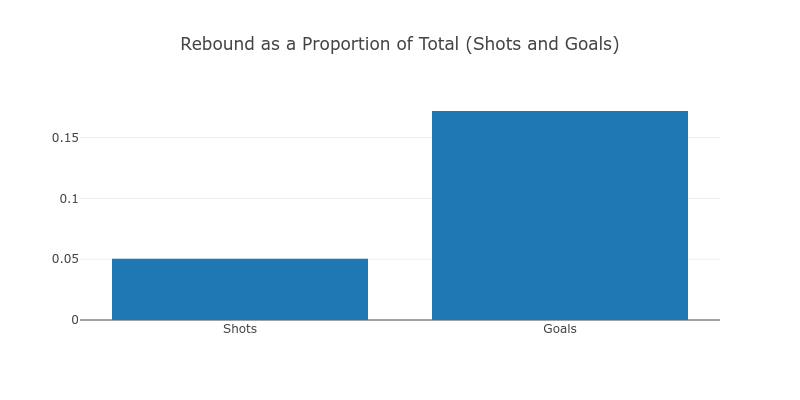
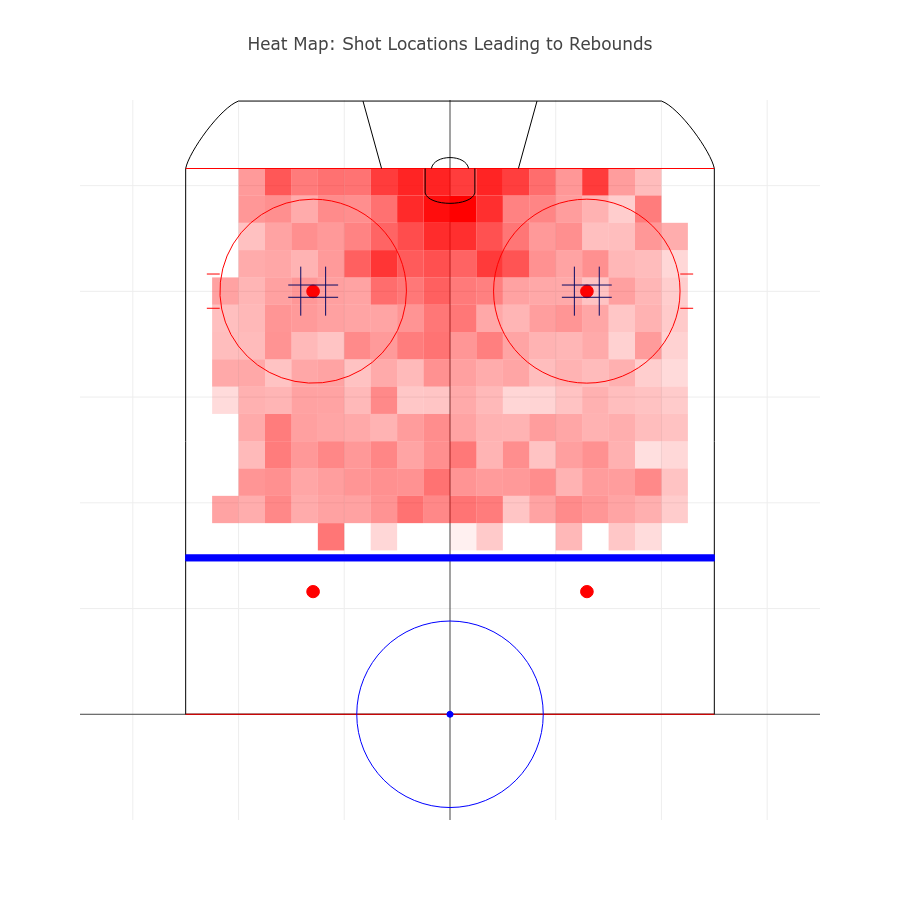
While shots leading to rebounds make up only 5% of all shots, they make up more than 15% of the all goals scored. On the below chart, we can see where those shots are on a heat-map.
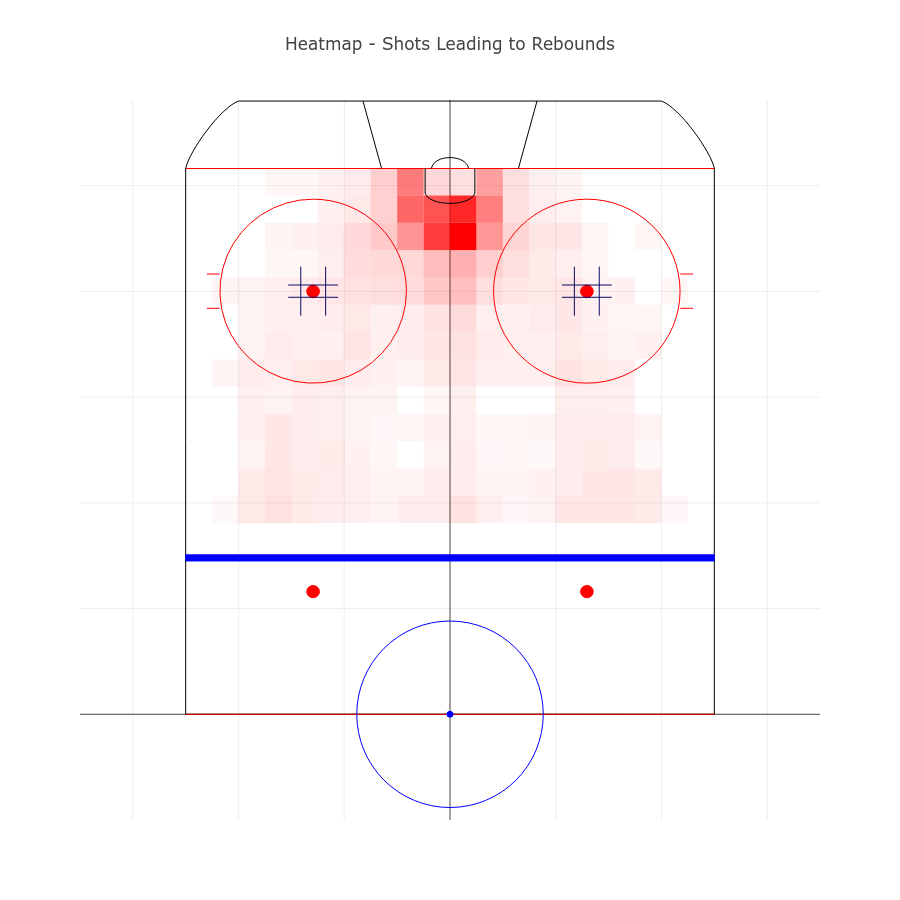
The majority of shots come from unsurprising places. If we look at that a bit differently — as the probably a shot from a specific location leads to rebounds we find something a bit more distributed. The closer to the box you are, the more likely a shot is to lead to a rebound, but the probability that a shot leads to a rebound is not as skewed as the actual shots taking place.
This points to a hypothesis that there is not as strong as a relationship between where shots are taken and their likelihood to lead to a rebound (i.e., scoring opportunity) as some may think. Perhaps teams should focus less on getting the right shots and more on taking more shots?
Good Shots vs More Shots
From what we have seen so far, it would make sense to hypothesize that a team that converts more shots into rebounds is more likely to win games. We have also noticed that there is an intense concentration of shots being taken very close to the night, even though those shots are harder to attain. Perhaps teams should focus more on taking any shot rather than the right shot?
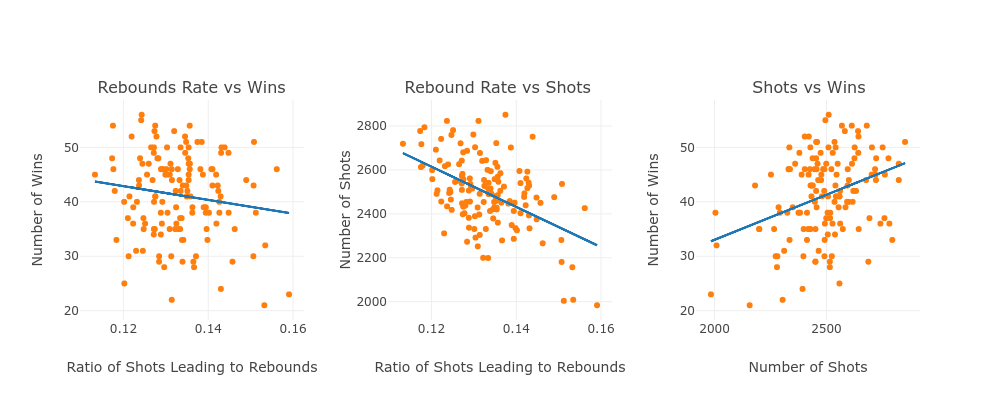
Over the data analyzed, a higher rebound rate does not actually correlate with a better win percentage. In fact, a higher rebound rate is associated with a lower number of wins!
We also find that a higher rebound rate has a strong relationship with fewer shots taken and also see that more shots = more wins.
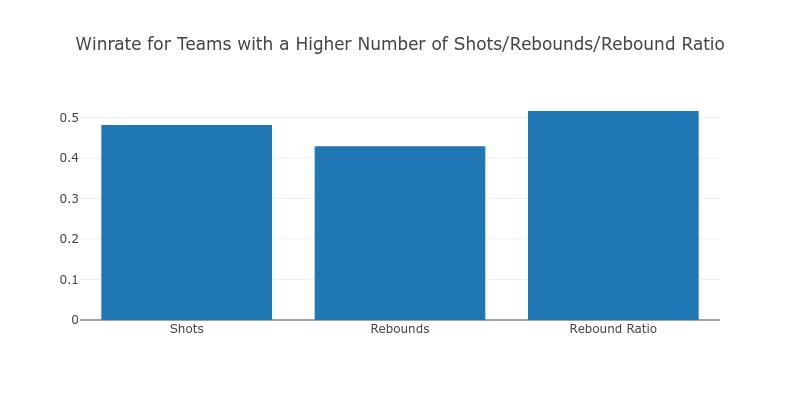
It is essential to think about the results above in context. There is a lot of variance across all the charts, but there are clear trends for some of the data points. Another way we could look at the data is to look at a game level rather than a seasonal level. Intriguingly, we find the opposite effect. When we look game by game, we see that the team with fewer shots often wins more games (by a small margin). Perhaps a team with a lower rebound ratio in a game points to better goal tending?
Keep in mind that the average number of rebounds per team per game is only 3.9. In most cases the team with the most rebounds has only 1 more rebound.
This is counter-intuitive — so much so that I spend a lot of hours combing through the code looking for errors. One reasonable explanation could be that over a season, a team with very few shots and a low rebound rate is indeed trying too hard to find the right shot. Conversely, a team with many shots is taking more shots (leading to better outcomes). Perhaps there is just so much variance in game-to-game statistics (as evidenced by many people that have done a similar analysis before me) that they are meaningless?
If you still do not believe me? Here is a plot of shots for the winning team vs. shots for the losing side. It is complete noise.
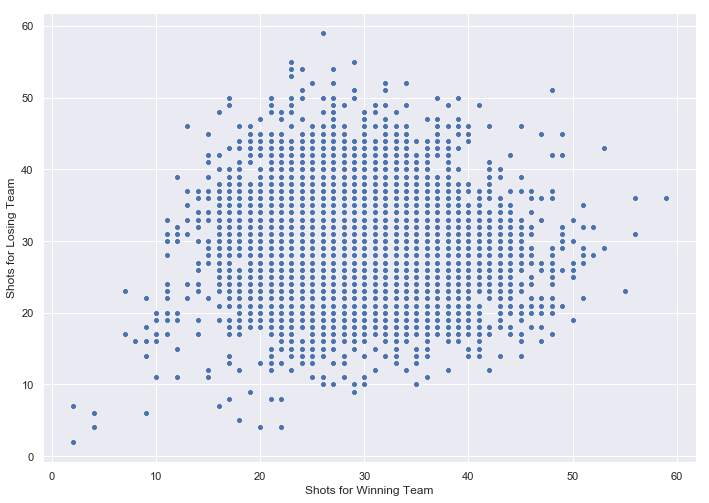
One specific example to point this out is the Carolina Hurricanes in the 2017–2018 season. They had the fourth highest shots-per-game, the least shots-against-per-game yet they did not make the playoffs.
Next Steps
One of the main takeaways from my analysis is that hockey is a very complex game. It is hard to point to individual statistics and make clear statements. To be sure, I am not the first to land here.
We do, however, find meaningful relationships (albeit weak ones) in statistics over a more extended period. It could be the case that while individual game statistics are very noisy (or, indeed, almost random), we can find much better relationships at a seasonal or monthly level.
The next article in the series will focus on groups of teams to better understand the relationship between shots, rebounds, team behaviors, and wins.
Credits:
-
Raw dataset here — https://www.kaggle.com/martinellis/nhl-game-data
-
Jumping off point for plotting the rinks — https://moderndata.plot.ly/nhl-shots-analysis-using-plotly-shapes/
This post was originally published on Towards Data Science on Dec 3, 2018: NHL Analytics: Shots, Rebounds, and Weak Signals.